A – First, let’s start by creating our basic control:
- Create a “customchart.jsp” file with the following lines and place it inside the folder “maximo/ applications/ maximo/ maximouiweb/ webmodule/ webclient/ components”:
- Register the JSP file as a component by creating a “customchart-component-registry.xml” file and place it inside folder “maximo/ applications/ maximo/ properties/ registry-extensions”
- Register a control using the component we just created by creating a “customchart-control-registry.xml” file in the same registry-extensions folder
- Build EAR file, Deploy, and Start Maximo server. (Note: for a development environment, if you place these files directly to the EAR package in Websphere’s installedApps folder, you only need to restart Maximo server to register the new control and component. After that, any change to JSP
file doesn’t need a restart) - Export Asset application and edit the application design XML file to add the new control above the Assetnum multipart textbox control:
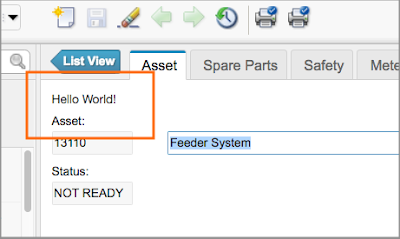
- Open the Asset application and we should see our new control with the placeholder text as in the following image:

B – Replace
our placeholder text with a dummy line chart
- Modify “customchart.jsp” to display a line chart with dummy data, and use the property to resize our control instead of using hard-coded value:
- Examine the code, you will notice that we use a few variables such as “component”, “dojo” without declaring them. It is because there are commonly used variables and libraries which have been declared or imported in the “componentheader.jsp” file we included when defining our component. You can examine this file to find out about other variables that you can use. One such is the “s” variable, which is an MXSession instance, which I will use later to query data from the Maximo database.
- Edit our Asset application XML file to specify the size of our custom control by adding the width and height property: <customchart id=”cust_chart_1″ dataattribute=”assetnum” width=”250″ height=”150″ />.
- Open the Asset application, and it should show a chart with dummy data as follows:

C –Update “customchart.jsp” display actual meter data:
- Using the MXSession instance variable “s” to retrieve meter data from the database: MboSetRemote readingsSet = s.getMboSet(“MEASUREMENT”);
- For the sake of simplicity, I hardcoded the query to display data of the “O-PRESSUR” meter from Asset “11450”. This is standard Maximo Mbo Java code. If you are already familiar with this, you will have no problem handling more complex requirements to display correct information here. (If you are not familiar with Maximo Mbo Java, you can learn the basics from Bruno’s blog)
- After retrieving the MboSet, we get the meter data and put it into an array in JSON format to pass it to Javascript which is processed at the client side by the browser to feed into our DOJO chart.
- Below is the full code of the customchart.jsp file:
- Re-arrange the layout a bit using application designer, we should be able to show the pressure chart of the pump on the main asset screen:

So there it is. I hope this series provides you with basic information to start playing with Maximo custom control and enables you to make Maximo more useful to your organisation or clients.


