
Another way to build a custom HTTP endpoint
Previously, I provided some examples of a custom HTTP end-point using the java.net.URL library. In a few cases, this library […]
Previously, I provided some examples of a custom HTTP end-point using the java.net.URL library. In a few cases, this library […]
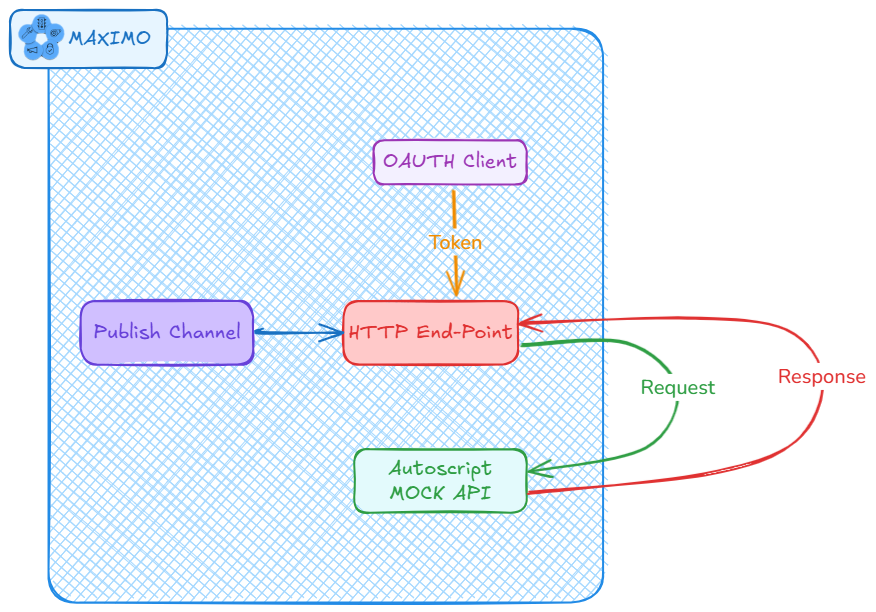
When building integration in #Maximo, sometimes, using a web service inspection tool is not possible. Another option is we can build a Mock API using Automation script to inspect the request.
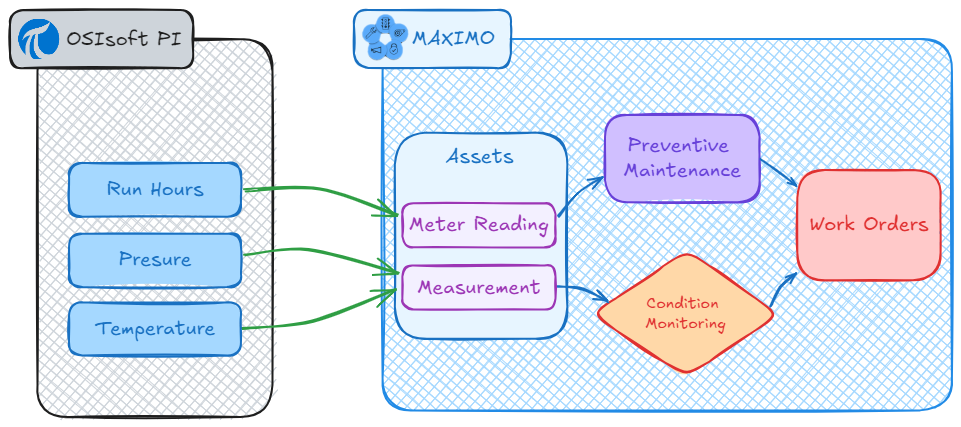
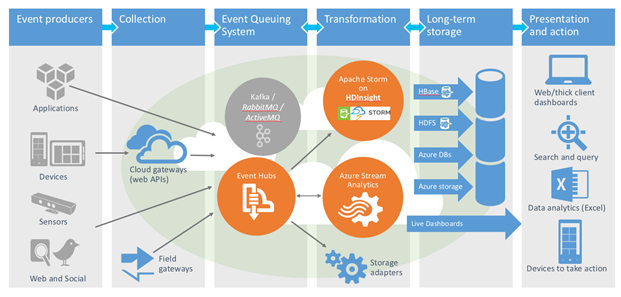
This article discusses some of the most common integration requirements between Maximo and other enterprise applications.
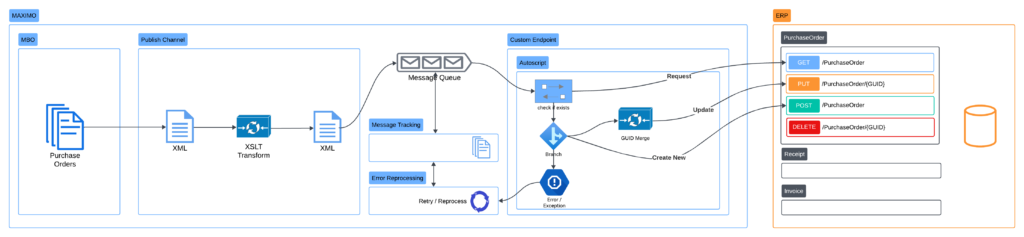
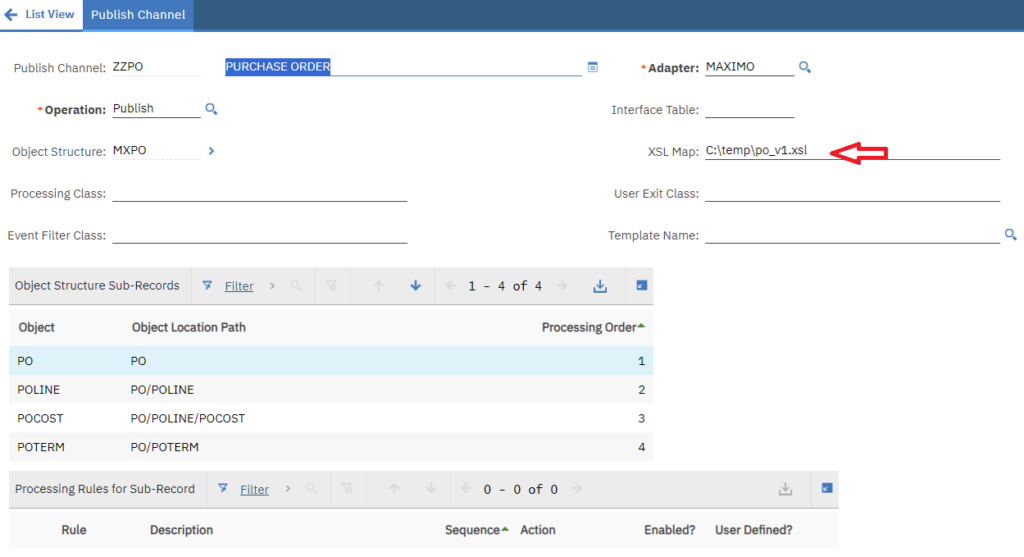
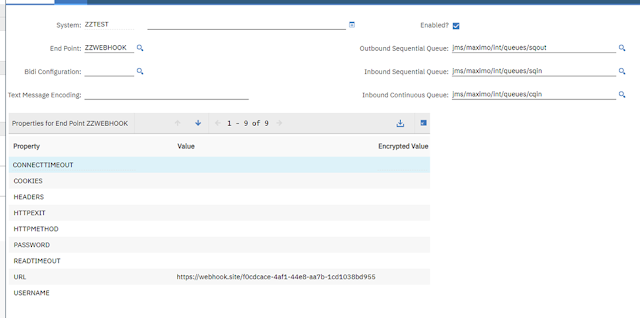
The custom endpoint can be associated with the publish channel and external system. This means, the interface is fully compatible with other MIF functionalities
Automation Script is powerful for implementing direct integration between Maximo and an external application. One main challenge of direct integration
For the HTTP End-point, we can set a fixed value in the request header. This doesn’t work for header values
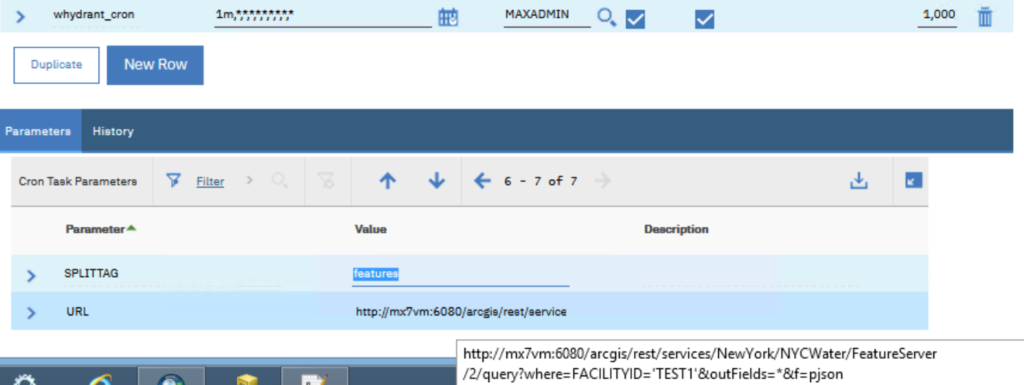
This is a weird issue with the ArcGIS – Maximo integration cron task. I like to record just in case
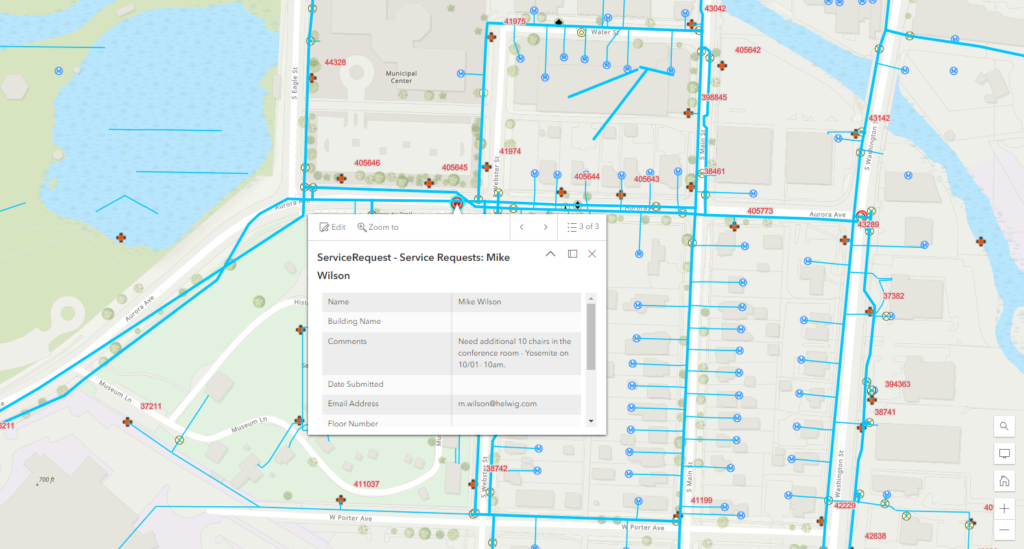
Detailed examples of how to send HTTP GET/POST requests from Maximo using Automation script by using a real-world example of an interface with ArcGIS Online
While the JSON API in the newer version of Maximo is quite useful, for many integration scenarios, I still prefer