Introduction
When building an application, we are in total control of the quality of the product. With integration, many elements are not under our control. Networks and firewalls are usually managed by IT. With external systems, we usually don’t know how they work. Many times, we don’t even have access. Yet, any changes to these elements can cause our integration interfaces to fail.
For synchronous interfaces where the user receives instant feedback, error notification is not needed. For asynchronous interfaces that don’t give instant feedback, failures usually go unnoticed. In many cases, integration failures are only found after they have caused some major damage, such as at the time of audit or when a management report is produced.
A good interface must provide an adequate ability to handle failures. With asynchronous integration, proper notifications and reports should be set up so that failures are captured and handled proactively by the system administrators.
On the one hand, it is bad to have no monitoring. On the other hand, too many alarms is even worse. The recipients usually ignore the alarms, including the critical issues. This is often seen in larger systems. Many readers of this blog won’t be surprised when they open the Message Reprocessing app and find thousands of unprocessed errors. Chances are, those issues have been accumulated and not dealt with for years.
It is hard to create a perfect design from day one and build an interface that works well in the first release. There are many kinds of problems an external system can throw at us. It is not easy to envision all possible failure scenarios. As such, we should expect and plan for an intensive monitoring and stabilizing period of one to a few weeks after the first release.
As a rule of thumb, an interface should always be monitored and raise alarms when a failure occurs. It should also allow resubmission or reprocessing of a failed message. More importantly, there shouldn’t be more than a few alarms raised per day on average from each interface, no matter how critical and high volume it is. If there are more than a few alarms per day, it will become too noisy, and people will start ignoring them. In that case, there must be some recurring patterns; each of them must be treated as a systemic issue. The interface should be updated to handle these recurring issues.
It is easier said than done, and every interface is a continuous learning and improvement process for me. Below are some examples of the interfaces I built recently. I hope you find it informative and entertaining.
Case #1: Integration of Intelligent Transport System to Maximo
Fulton Hogan built and is now operating the M4 freeway in Sydney. They use Maximo to manage maintenance works on civil infrastructure assets. Kapsch provided toll point equipment and a traffic monitoring system (ITS). From this ITS system, device status and maintenance work orders are exported daily as CSV files and sent to Maximo via SFTP. On the Maximo side, the CSV files are imported using a few automation scripts triggered by a cron task.

The main goal of the interface is to maintain a consolidated database of all assets and maintenance activities in Maximo. It is a non-critical integration because even if it stops working for a day or two, it won’t cause a business disruption. However, occasionally, Kapsch stopped exporting CSV files for various reasons. The problem was only found out after a while, like when someone tried to look up a work order but couldn’t find it, or when a month-end report looked off. Since we didn’t have any access to the traffic monitoring system managed by Kaspch, Maximo had to handle the monitoring and alarms of this integration.
In this case, the difficulty is, when the interface on Kapsch’s side fails, it doesn’t send Maximo anything, there would be no import, and thus no errors or faults seen by Maximo to raise any alarm. The solution we came up with is having a custom logging table in which we write each import as an entry with some basic statistics including import start time, end time, total records processed and the number of records that failed. The statistics are displayed on the Start Center.
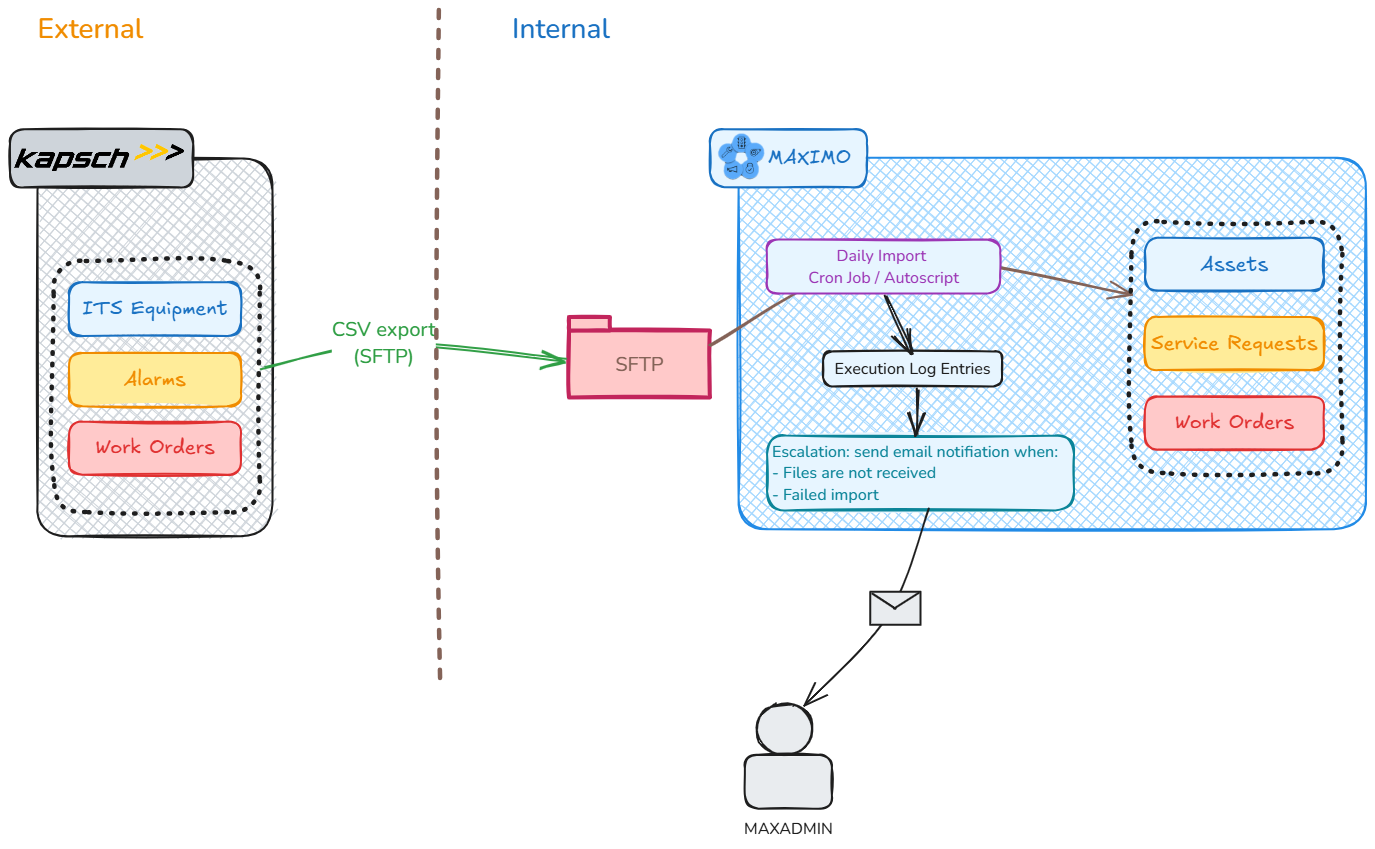
For alarm, since this integration is non-critical, an escalation is set to monitor whether there has been no new import within the last 24 hours, Maximo will send out an email to me and the people involved. There are actually a few different interfaces in this integration, such as for device list and preventive maintenance work coming from TrafficCom, or corrective work on faults coming from JIRA. Thus, sometimes, when a system stopped running for various planned or unplanned reasons, I would receive multiple emails for a couple of days in a row, which is too much. So, I tweaked it even further by sending only one email on the first day if one or more interfaces stopped working, and another email reminding me a week later if the issue had not been rectified. After the initial fine-tuning period, the support team on Kapsch and Maximo’s side is added to the recipient list, and after almost two years, the integration has been running satisfactorily. In other words, there have been a few times when files were not received on the Maximo side and the support people involved were always informed and able to take corrective action in a timely manner before the end-users could notice.
Case #2: Integration of CRM and Maximo
A water utility in Queensland uses Maximo for managing infrastructure assets, tracking, and dispatching work to field crews. When a customer calls up requesting a new connection or reporting a problem, the details are entered into Unify (a CRM system). The request will then be sent to Maximo as a new SR, and then turned into work orders. When the work order is scheduled and a crew has been dispatched, these status updates are sent back to CRM. At any time, if the customer calls up to check on the status of the request, the call centre should be able to provide an answer by looking up the details of the ticket in CRM only. Certain types of problems have high priority such as major leaks, sewage overflow, or water quality issues. Some issues have SLAs with the maximum response time as low as 20 minutes. As such, this integration is highly critical.

WebMethods is used as a middleware to handle this integration, and as part of the steps for sending new SR from CRM to Maximo, the service address will also need to be cross-checked with ArcGIS for verification and standardization. As you can see, there are multiple points of failure with this integration.
This integration was built several years ago, and there were some levels of alarms set up in CRM on a few points where there is a high risk of failure. For example, when a Service Order is created but not picked up by WebMethods or picked up but not sent to Maximo. Despite this, the interface would have a failure every few weeks, thus, it needed to be rebuilt. In addition to existing alarms coming from CRM, several new alarm points were added in Maximo and WebMethods:
- When WebMethods couldn’t talk with CRM to retrieve a new Service Order
- When WebMethods couldn’t send a status update back to CRM
- When WebMethods couldn’t talk to Maximo
- When Maximo couldn’t publish messages to WM
These apply to individual messages coming in and out of Maximo and CRM and any failure would result in an email sent to the developer and the support team.

In the first few days after this new interface was released to Production, the team received a few hundred alarms each day. My capacity to troubleshoot was about a dozen of those alarms a day. Thus, instead of trying to solve them. We tried to identify all recurring patterns of issues and address them by modifying the interface design, and business process, or fixing bad data. A great deal of time was also spent on trying to improve the alarms. For example, for each type of problem, the detailed error messages and the content of the XML message itself are attached to the email notification. This allows the receiver to know what causes the issue without having to log into the system and dig through the transactions and log files.
A new “fix patch” was released to Production about two weeks after the first release, and after that, the integration only produced a few alarms per month, most of which are valid business transactional errors rather than system failures. After a year now, all the possible failure points that we envisioned, no matter how unlikely they could happen, have failed, and raised alarms at least once. However, the support team has always been on top of them. I’m glad that we built in all those monitoring features in the first place. And as a result, I haven’t heard of any issues that have not been fixed before the end-users become aware.
Case #3: Interface with medium criticality/frequency
Of the two examples above, one is low frequency/low criticality; the other is high frequency and high criticality. Most interfaces are somewhere in the middle of that spectrum. Interfaces that are highly critical but don’t run frequently or don’t need a short response time can also be put into this category. In such cases, we might not need to send individual alarms in real-time. As a rule of thumb, if an interface raises a few alarms per day, it is too much. As developers, if we can’t handle more than a few alarms a day, we shouldn’t do that to the support team (sending them alarms all day long). For the utility company mentioned above, when WebMethods was first deployed, the developer configured a bi-daily report that lists all failed transactions that occurred in the last 12 hours. Thus, for most interfaces, we don’t need to set up any specific alarms. If there are a few failures, they will show up in the report and will be looked at by technical support at noon or at the end of the day. This approach works well for us, even for some critical interfaces such as bank transfer orders or invoice payments.

Case #4: Recurring failure resulting in too many alarms
For the integration mentioned in #1 and #2, the key to getting them to work satisfactorily is to spend some time after the first release to monitor the interfaces and fine-tune both the interface and the alarms. It is important to have alarms raised when failure occurs, but it is also important to ensure there aren’t too many alarms raised. People will ignore the alarms if there are too many of them. When the receiver is inundated with too many alarms, it’s difficult to tell the critical issues apart from the less important ones.
From my experience, dealing with those noisy alarms is easy. Most of the time, the alarms come from a few recurring failures. At first glance, a high number of errors in a log file can look overwhelming. It is understandable if we feel reluctant to address them. The strategy is to attack each issue one by one and carefully document the error and the solution for each problem in an Excel spreadsheet. Usually, after going through a few issues, some recurring patterns emerge. By addressing those recurring problems, the error log can be cleaned up quickly.

As an example, a water utility in regional Victoria uses an external asset register system, and the asset data is synchronized to Maximo in near real-time. The interface produces almost 1GB of SystemOut.log file each day. It made the logs useless. I looked at asset synchronisation errors and documented them one by one. After about two hours, it was clear that 80% of the errors were due to missing locations. When the interface creates new assets under these locations, Maximo produces a lot of error traces to the SystemOut.log file. I did a quick scan and wrote down all of the missing locations and quickly added them to Maximo using MXLoader. After that, the number of errors was reduced significantly. By doing occasional checks of the log files in the following few days, I was able to list all missing locations (there were about 30 of them in total) and able to remove all errors caused by this asset synchronisation process. The remaining individual errors found in the log files were easily handled separately. Some critical issues only came under the radar of the business after that.


Pingback: How to use custom endpoint for dynamic delivery?