I often have to troubleshoot the issue of integration messages not getting processed. Most of the time, I got it right and was able to identify the problem quickly. In a few cases, it took some time and was stressful. These usually occur in Production. (They happen in DEV and PRE-PROD all the time, it’s just that people usually don’t care, and it goes unnoticed)
Today I had to deal with it again and it took me some time. The cause was something I dealt with before and I was told by a colleague how to fix it the easy way, but I forgot. This time around, under the panic mode, I restarted a few JVMs before I remembered I should ask around and was reminded by my colleague again that it could be fixed with much less damage. I told myself I should write it down for the next time
Below are the notes on what I learned:
Publish Channel in Maximo uses Sequential Queue by default. When a message fails, it will stop processing other messages.
In some systems, the behaviour (Sequential processing) can be disabled by simply changing the error output of SQOUTBD bus destination from “none” to “system” or an error queue.
Check Message Tracking to see if there are messages stuck in “RECEIVED” status. If there are many of those messages. it means JMSConsumer doesn’t run, or it does run but one message failed (has ERROR status in Message Reprocessing), and thus everything else got stuck. If there is no message in “RECEIVED” status, it is either because Publish Channel is not enabled, or because Message Tracking is not enabled.
For Publish Channel to publish messages, we need both the External System and the Publish Channel to be enabled. Event Listener on the Publish Channel should be enabled (unless it is triggered by something else like an Autoscript)
If Message Tracking is not enabled for the Publish Channel, we should enable it (now), unless the interface is extremely unimportant, and no one cares.
If there are a ton of “RECEIVED” messages in Message Tracking, it’s likely due to two reasons noted below. Messages that get published successfully have “PROCESSED” status.
If there’s an error in Message Reprocessing that blocks the queue, try to re-process, or delete it to clear the blockage.
If there’s no blockage in Message Reprocessing, it’s likely due to JmsConsumer cron task not running. Try reactivating/reloading the cron instance. Make sure to enable the “Keep History?” flag. After re-activating and reloading the cron instance. If it shows “START”, but doesn’t show “ACTION”, it means the Cron instance doesn’t run. It’s likely there’s a hang scheduler task. It can be resolved by restarting the concerned JVM/server. This is the bad approach used today. The easy way is to query and delete the task entry in “TASKSCHEDULER” table. Don’t worry, once deleted, the cron task instance will create a new task entry on the next run
For blockage on sequential queue, on a non-prod environment, we can see queue depth and clear all of those messages in the queue to clear the blockage using two methods below:
In Maximo, go to External Systems > Action Add/Modify Queues > Select “sqout” > choose View (or Delete Queue Data)
In Websphere, go to Service Integration > Buses > Destinations > SQOUTBD > Queue Points. It will show Queue Depth which is the number of messages in the queue. Click on the link to open > Runtime tab > Messages > Delete or Delete All
Working with Maximo, we have to deal with network/firewall all the time. I can spend a whole day telling you fun stories (or extremely frustrating experience) I had with IT/Network guys. But that’s not the point. If you end up here, I guess you’re having an issue with firewall. So below is a quick recap of my tricks:
– Ping: the first thing we try when we want to see if a server is accessible from our current machine. But don’t jump to a conclusion too early if it shows the server is unreachable. Sometimes, the Network Admin has disabled ping response to enhance security.
– Telnet: to check if a port is opened, we can use telnet from Windows Command console (e.g. telnet google.com 80). If it can be connected, means the target server is accessible on the specified port. But if it doesn’t, first, make sure the server is listening on that port, before jumping to a conclusion that it’s a Firewall issue. I made this mistake a few times, blaming the network, then it turned out it’s Websphere/Maximo service is not running on the port that I assumed it should be running on
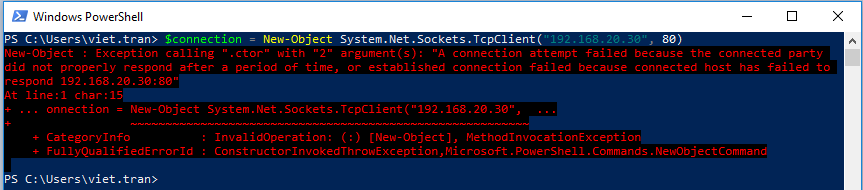
– PowerShell: in many cases, the server is not connected to the Internet, and Telnet is not installed, (and yes, you don’t have permission to install new software either). We can use PowerShell to check network connectivity using the two commands below:
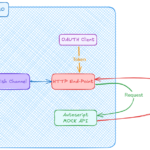
Last week, while attending a call to discuss an integration interface between Maximo and an Azure SQL database, the other consultant mentioned a few Azure terms like “blob storage”; I realized I didn’t know anything about Azure despite the fact that the cloud platform has been adopted by the large number of the clients I work with. So today, I decided I should play around a bit with it by trying to migrate a Maximo instance from my local VM to Azure.
Before I go into the technical details, for those of you non-technical readers, I like to sum up the whole experience I had with this platform in one word: magical. That’s it, I went to the website, signed up for a trial account, followed some wizards or clicked on a few buttons or menus that I think were features I need, and boom, I got a running Maximo instance on the cloud in just a few hours. No training, no muss, no fuss, everything just works. Not much else to say. I’m in love now. I think will spend the next couple of weeks, months or even years to learn more about Microsoft stuff.
Below are
the steps that I took:
1.1. Sign up for a trial account. After created the account, I was given $260 AUD to spend on paid services
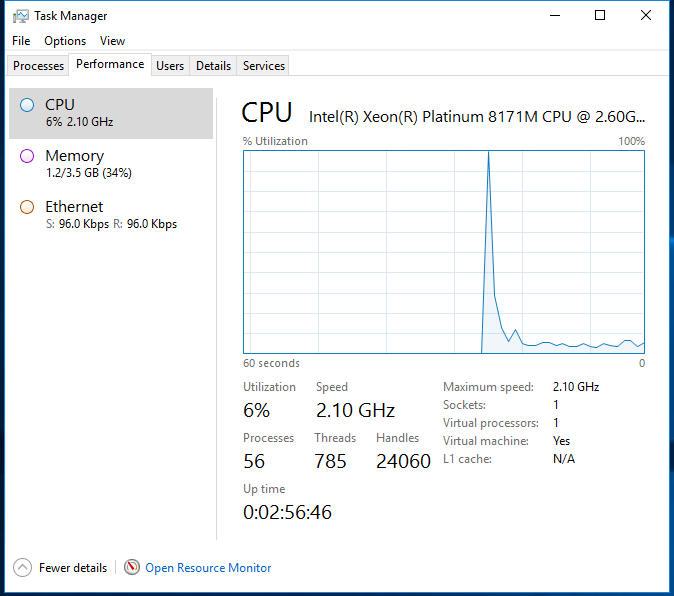
1.2. I went straight to the portal and tried to create a new VM. Being cheap as I am, I went to the lowest option of 1 CPU + 3.5GB RAM. I know to install Maximo, I’ll need at least 8GB, but in this case, I just wanted to see if I can fit Windows, Websphere and Maximo into a box this size
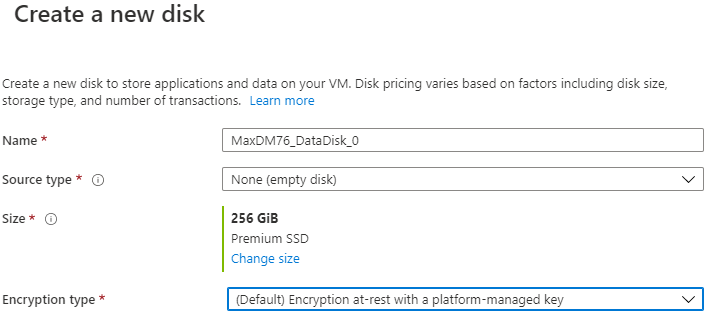
1.3. Next page, I gave the VM a 256GB SSD data disk
1.4. For network setting, I gave it a Public IP as I want to access Maximo from public Internet
1.5. On the next few pages, I left the default settings and proceeded to create the VM. After about 5 minutes, the VM was created. I clicked on “Connect”, and it downloaded an RDP shortcut which will open the Remote Desktop app on my laptop and pre-populated it with the IP address of the machine. I struggled at this step a bit because I forgot that I created a Window user account in the 1st step. Thus, I tried to use my Microsoft account instead and it failed. After a few failed attempts and a quick google search, I remembered the details and entered MaxDM76AzureUser for account name, could login with that. The machine is extremely fast and responsive, feels like working on a local server rather than some remote sessions on the cloud (Now I remember how frustrating I was having to deal with the sluggish Maximo SaaS Flex DEV server). Download files gave me a rate of 50-70MB/s (that’s megabytes per second not Mbps)
<This screen was
captured after the fact as I forgot to take a screenshot of this step>
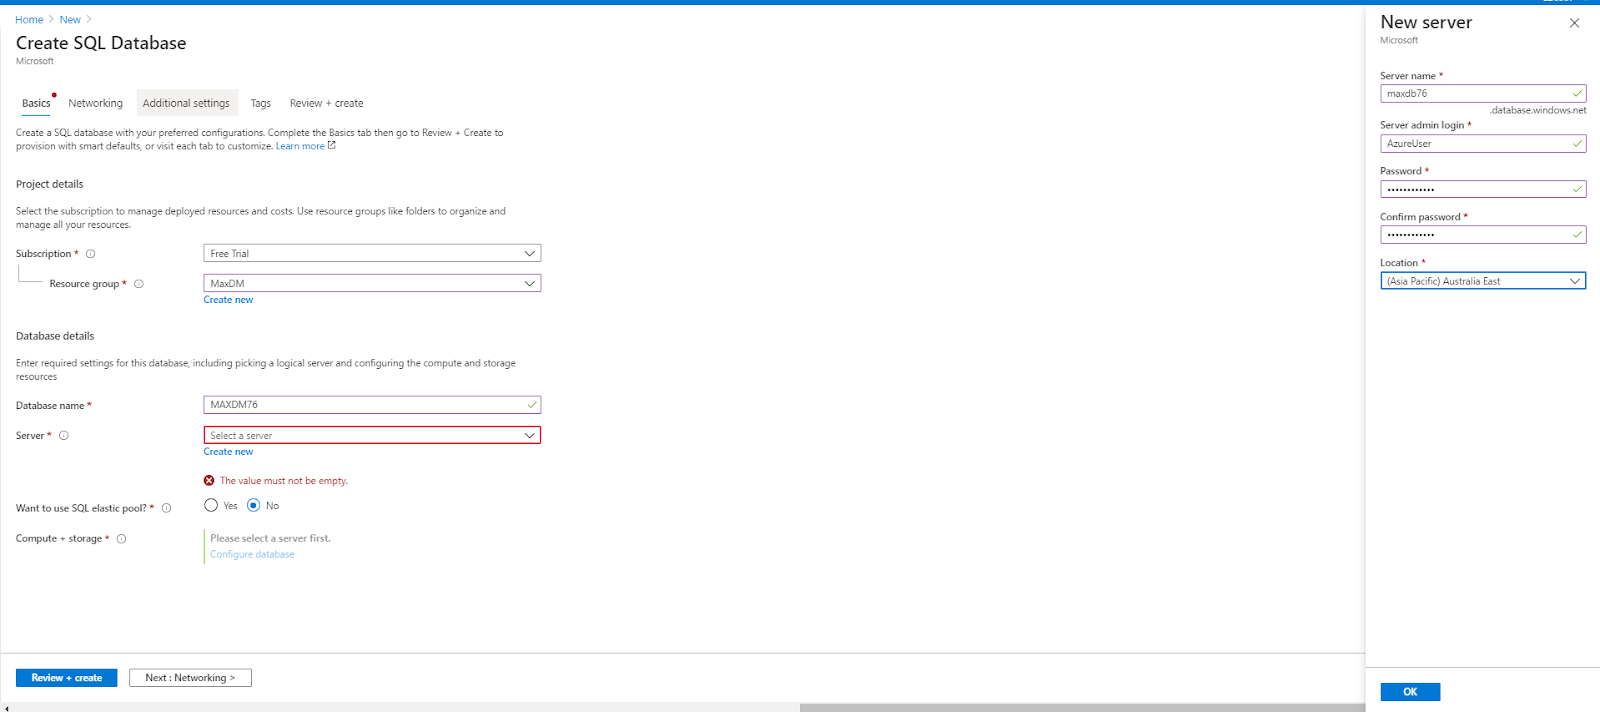
2.1 Next step, I tried to create an SQL DB. I put it in the same Resource Group as the Maximo App Server VM Because, naturally, I think all resources for an application should be put in one Resource Group as the name suggests. To be honest, I still have no idea what it is now. On the “Server” drop-down, since it is empty, I had to click on “Create New” and created a new server. I think we cannot remote access to this one like a VM, just a logical name to manage an SQL instance.
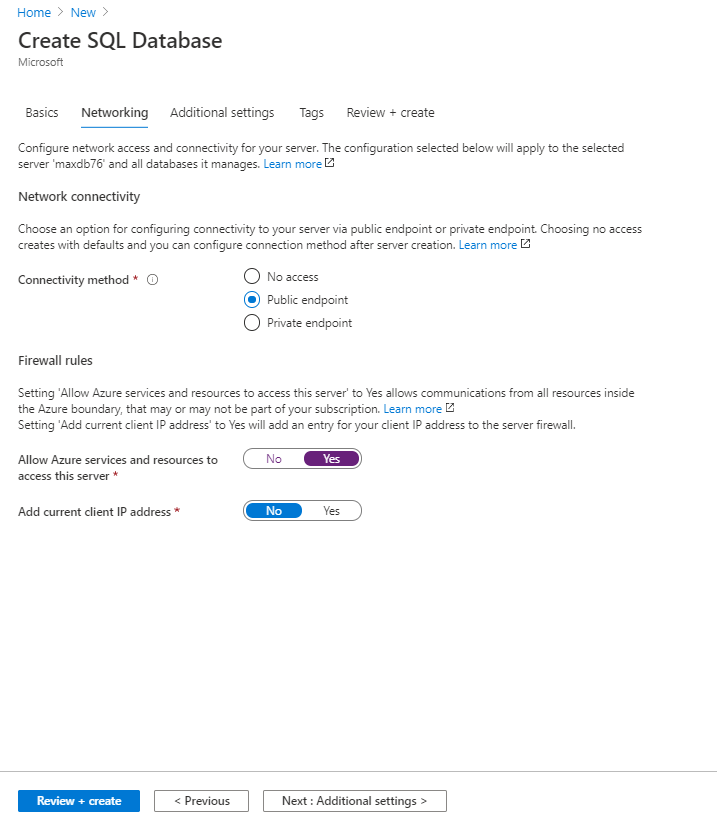
2.2 On the Networking page, I chose Public Endpoint for Connectivity Method because I thought I need to access the DB from SQL Studio on my Laptop, and Allow Azure services and resources to access this server because I think this option lets Maximo on App Server VM to access the DB. It turned out I couldn’t figure out how to access the DB using SQL Studio on my laptop (more on this later), but the second option works exactly as it supposed to do.
2.3 Default settings for the next few pages then I proceeded to create the DB.
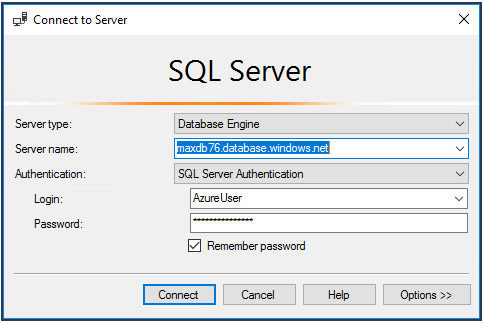
2.4 I attempted to connect to the DB using SQL Studio on my laptop but it didn’t work. However, I tried to install SQL Studio on the Azure VM and it worked on the first try.
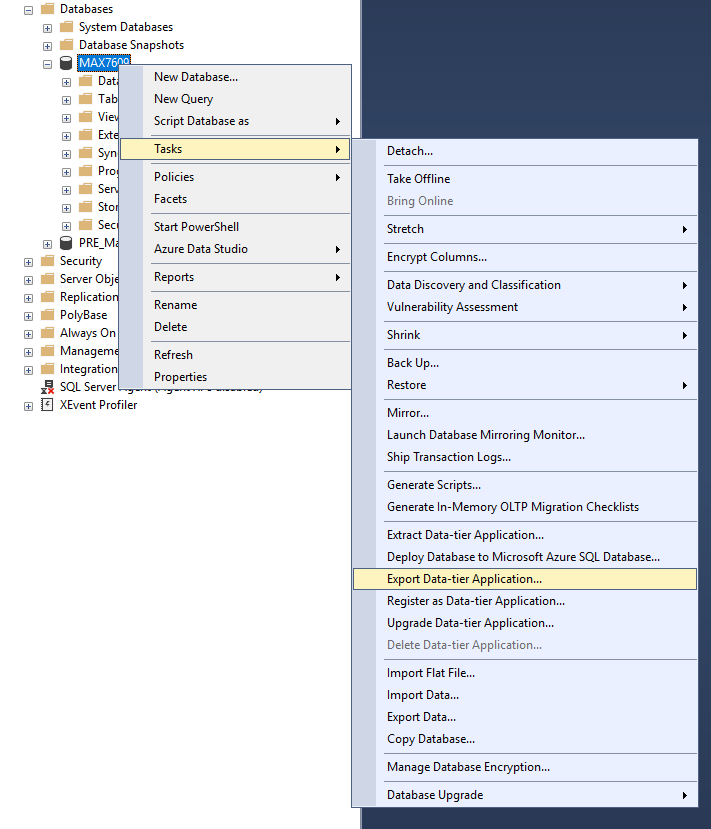
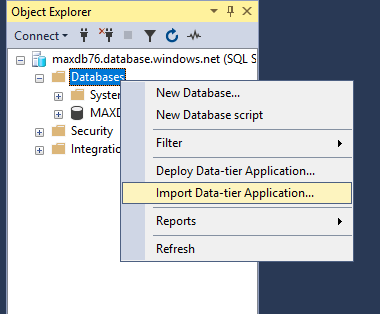
3.1 Now I had a server and a DB, I proceeded with Maximo migration. I backed-up the SQL DB in my VM to a DMP file, uploaded it to Azure VM, and tried to Restore it to Azure SQL. It turned out on-premises SQL Server is different to Azure SQL, and I can’t do that. A quick google search revealed that I had to export the DB into a *.bacpac file, then import it to Azure.
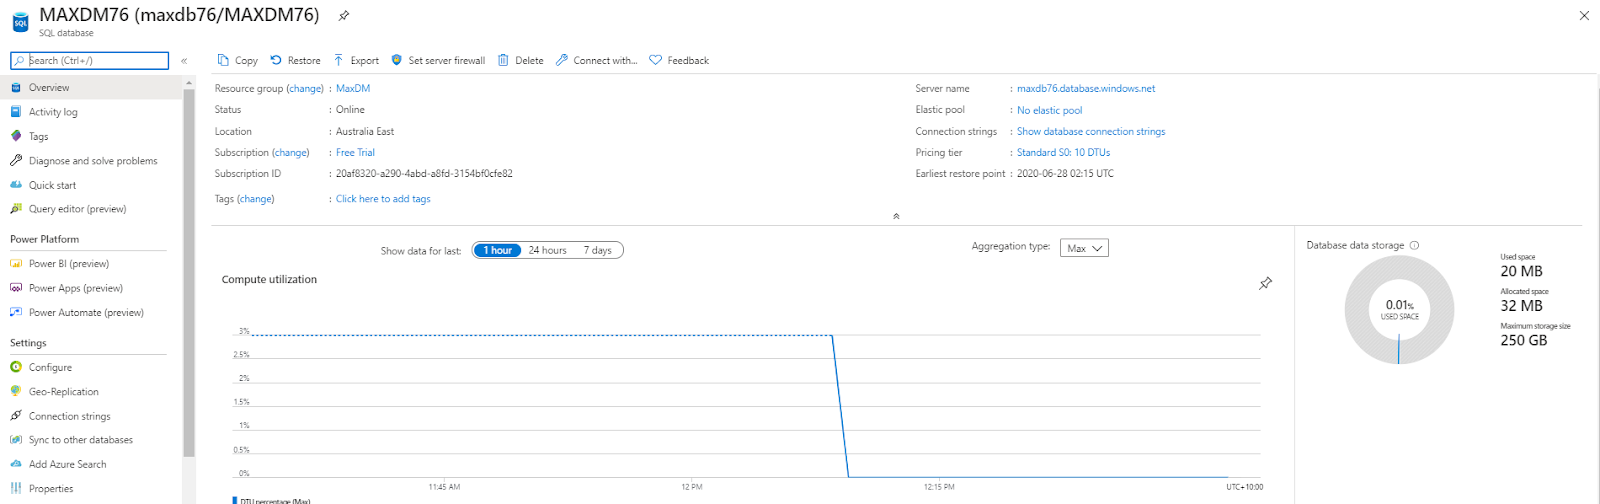
3.2 The whole export/import of bacpac file was straight-forward with a minimum number of clicks, and no confusion. After it’s done, I realized the import process restored the DB from my VM, and I ended up with two DBs, so I had to delete the empty one I created in the earlier step.
3.3 I struggled a bit trying to create a new ‘maximo’ user. Turned out the way security logins and users are managed in Azure SQL is a bit different, so after a bit of googling, I found some scripts I could use. So here is the notes I wrote down for this step
– Right click the “Database Folder”, to add a new Query window:
CREATE LOGIN maximo WITH PASSWORD =
‘SuperSecret!’
– Right click the ‘maxdm7609’ to add a new Query window:
CREATE USER maximo FOR LOGIN maximo WITH
default_schema = dbo;
ALTER ROLE db_owner ADD MEMBER maximo;
4.1 Next step is to install Websphere, a quick check before installing showed I had 2.3 GB RAM left, I thought could make Websphere to take 1GB and Maximo 1GB, so I proceeded with the installation.
4.2 It turned out that although I can install Websphere successfully, the automated process to prepare the environment for Maximo failed due to Out-of-Memory error. I know we could manually configure WebSphere and make it works, but what’s the point in wasting time doing that? So I uninstalled Websphere, upgrade the VM to the next lowest option which has 2 CPU and 8GB RAM, then attempted to install Websphere again, which worked this time.
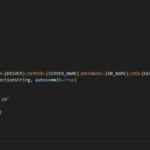
4.3 I uploaded a pre-built maximo.ear file from my local laptop to Azure VM, deployed it to Websphere, then updated the connection string to point to the Azure SQL DB. Connection string is almost exactly the same as connecting Maximo to a local SQL DB. And it worked immediately after I tried to start MXServer after deployment.
(Installing Websphere and Deploying maximo is not the topic of this post, so I’m not going to put the details of those steps here)
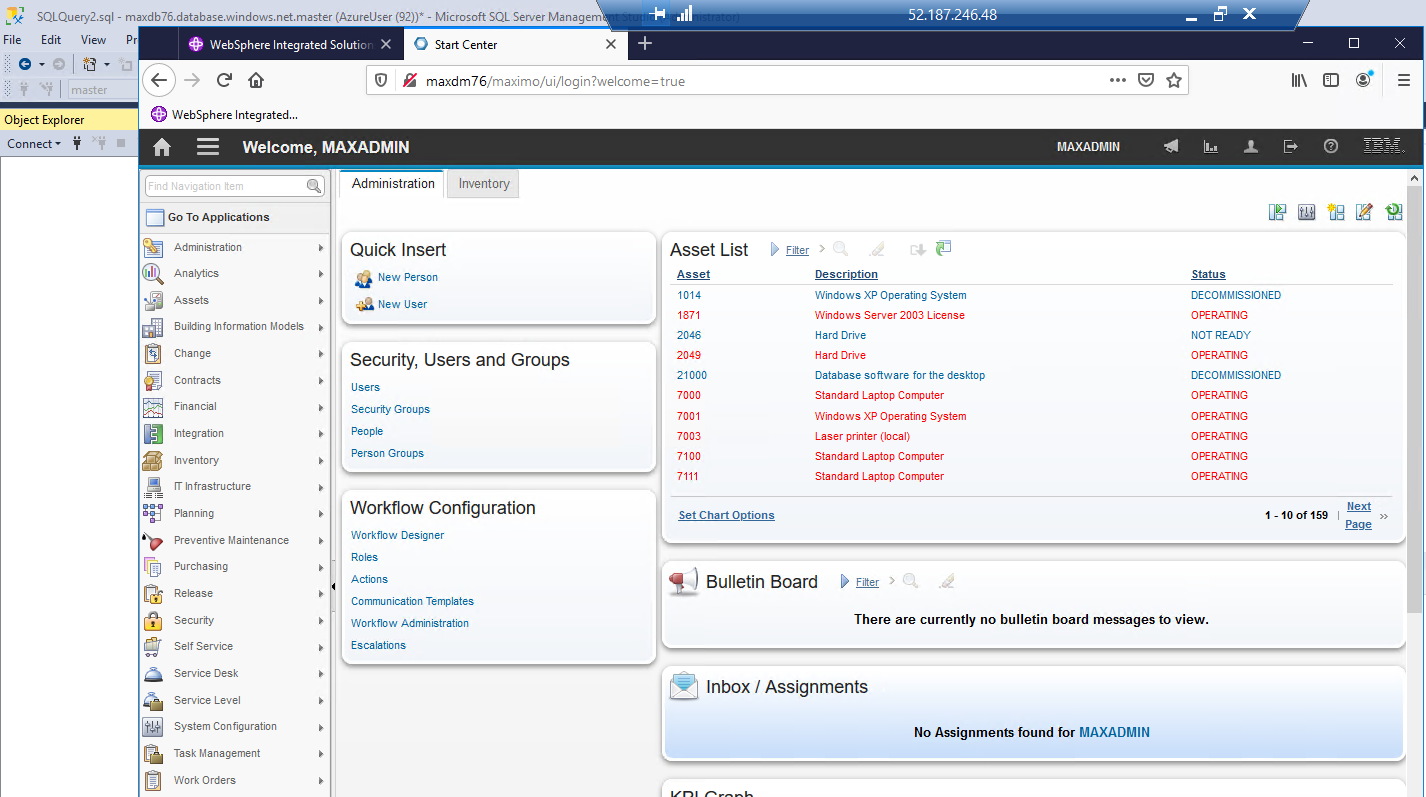
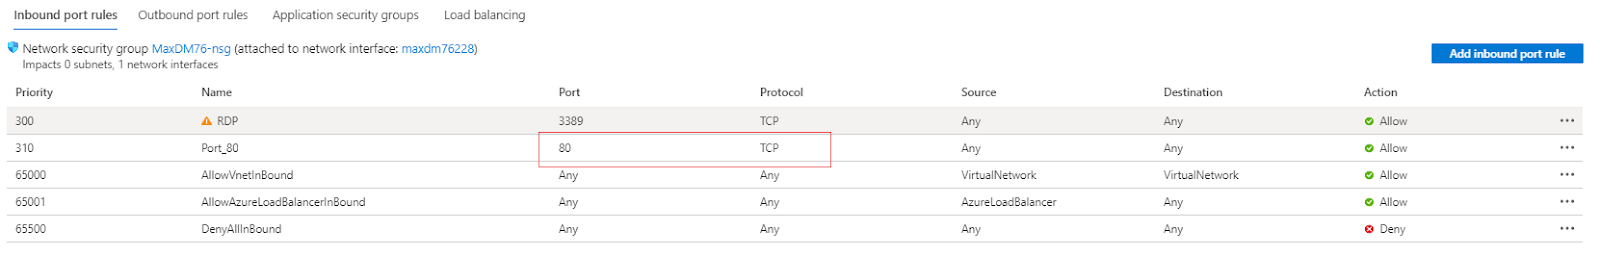
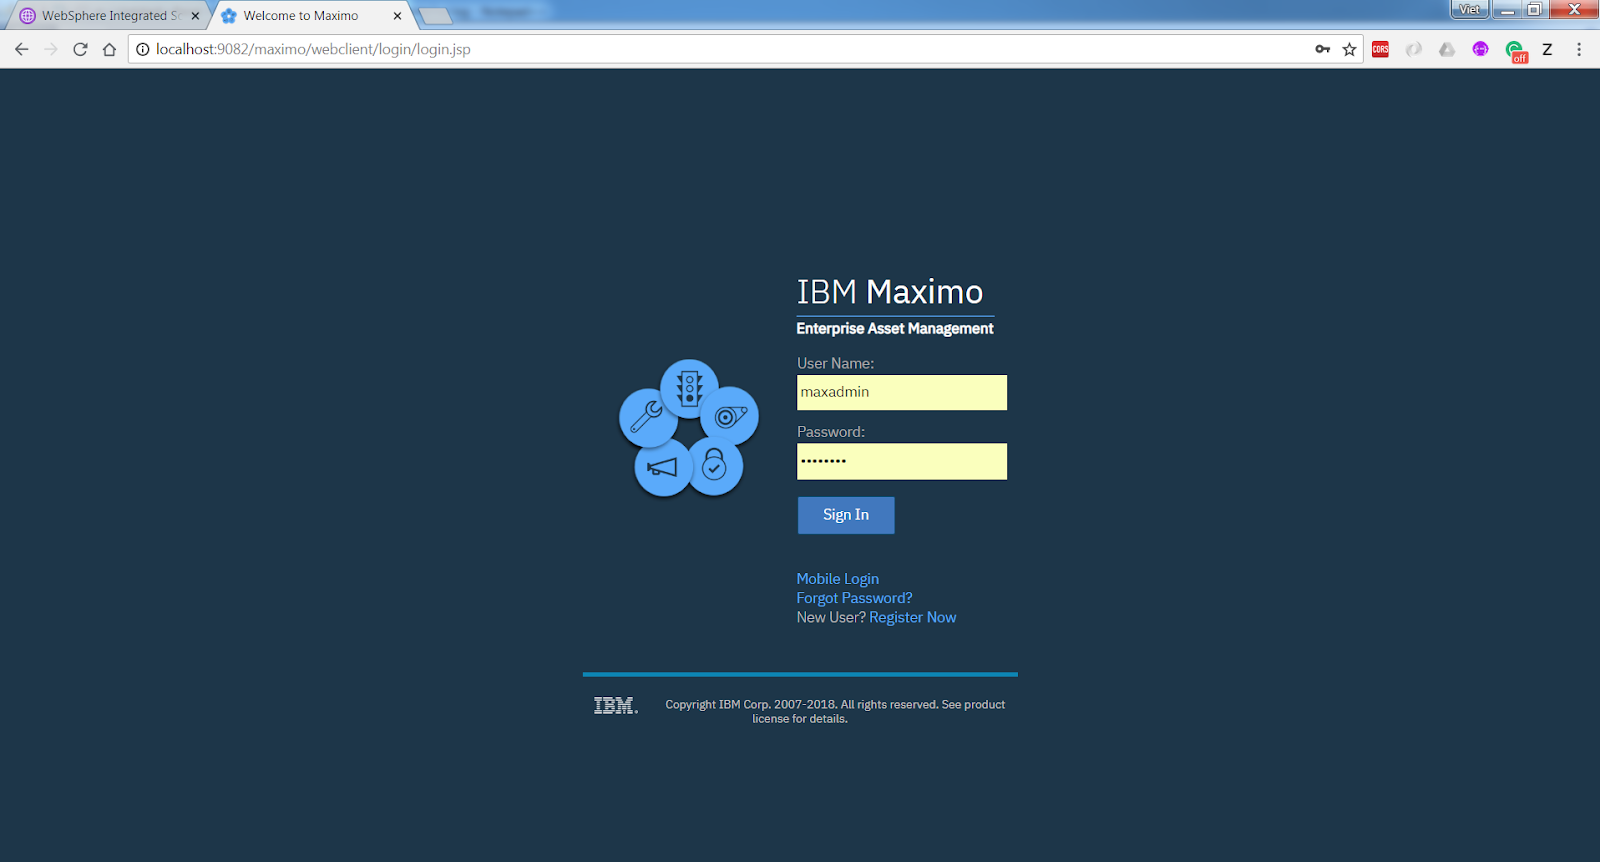
5.1 Now I got Maximo running on the VM, I wanted to access it from the Web, so I went to the VM’s Networking page, and opened port 80 inbound for the VM, but it still didn’t work. After a bit of fussing around, I remembered I had to open the port on the VM’s Windows Firewall as well. After opened port 80 on both two firewalls, it worked like a charm, I could access Maximo from my laptop using the VM’s public IP
5.2 I wanted to have a DNS to access it as well, so in the VM’s IP setting, I set it to Static (which I think will prevent it to change even if I shutdown the VM), and put a DNS name label.
5.3 Right after I clicked on Save, I can access Maximo using a DNS alias. Mission accomplished
I have a fair share of experience with various software and platforms ranging from great, good, bad, or horrible. I can live with bad software, but it irritates me to the bone. I feel good when playing with good software. In this case, I think Microsoft has done everything right designing the Azure platform, I felt nothing but joy throughout this whole learning process. My next step is probably to recommend anyone I meet to put Maximo on Azure if they are considering moving to cloud.
Occasionally, Maximo became unavailable for a short period of 5-10 minutes. Alarms were raised, IT help desk was called, and the issue got escalated to the Maximo specialist (you). You logged into the server, checked the log file, and found a Java Out-of-Memory (OOM) issue. Not a big deal, the server usually restarted itself and became available soon after that. You reported back to the business and closed the issue. Does that scenario sound familiar to you?
If such an issue has only occurred to your system once, it was probably treated as a simple problem. But since you had to search for a solution on the web and ended up here, reading this article, probably it has occurred more than once, the business requires it to be treated as a critical incident. As the Maximo specialist, you’ll need to dig deeper to report the root cause of the issue and provide a fix to prevent it from occurring again. Analyzing low level Java issue is not an easy task, and this post describes my process to deal with this issue.
Websphere Dump Files
By default, when an OutOfMemory issue occurrs, Websphere produces a bunch of dump files in the [WAS_HOME]/profiles/<ProfileName>/ folder, these files can include:
Javacore.[timestamp].txt: contains high-level details of the JVM when it crashed which should be the first place to look in a general JVM crash scenario. However, in the case if I know it is an OutOfMemory issue, I generally ignore this file.
Heapdump.[timestamp].phd: this is the dump from the JVM’s heap memory. For an OOM issue, this contains the key data we can analyse to get some further details.
Core.[timestamp].dmp: These are native memory dump. I get these as I work with Maximo running on Windows most of the time. A different operating system, such as Linux, might produce a different file. I often ignore and delete this file from the server as soon as I find there is no need for it. However, in certain scenarios, we can get some information from it to help our analysis as demonstrated in one scenario described later in this article.
IBM Heap Analyzer and Windows Debugger
In general, with an OOM issue, if it is a one-off instance, we’ll want to identify (if possible) what consumed all JVM memory. And, if it is a recurrence issue, there is likely a memory leak problem, in which case, we’ll need to identify the leak suspects. To analyse the heap dump (PHD file), there are many Heap Analyzer tools available, I use Heap Analyzer provided with the IBM Support Assistant Workbench
To read Windows dump files (DMP file), I use the Windows Debugger tool (WinBdg) that comes with Windows 10. Below are some examples of crashes I had to troubleshoot earlier, hopefully they give you some generally ideas on how to deal with such problem.
Case 1 – Server crashed due to loading bad data with MXLoader
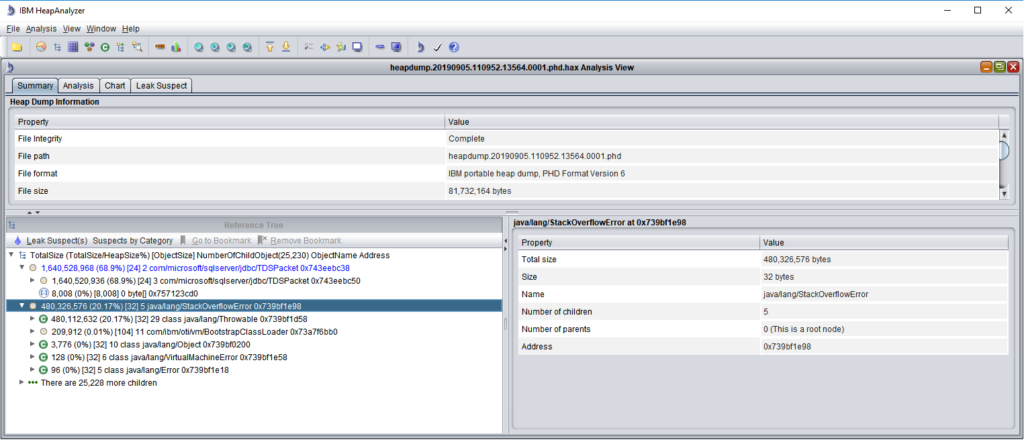
A core dump occurred to the Integration JVM of an otherwise stable system. The issue was escalated to me from level 2 support. Using Heap Analyzer, I could see Maximo was trying to load 1.6 GB of data into memory which equals to 68% of the allocated heap size for this JVM. There was also a java.lang.StackOverflowError object which consumed 20% of the heap space.
This obviously looked weird, but I couldn’t figure out what was the problem. So, I reported this back to the support engineer, together with some information I could find from SystemOut.log that, immediately before the crash occurred, the system status looked good (memory consumption was low), and there was some high level of activities by a specific user. The support engineer picked up the phone to talk with the guy, and found the issue was due to him trying to load some bad data via MXLoader. The solution includes some further training on data loading to this user, and some tightening of Maximo integration/performance settings.
Figure 1: Analyzer shows a huge 1.6Gb of SqlServer TDSPacket object
Case 2 – Server crashed due to DbConnectionWatchDog
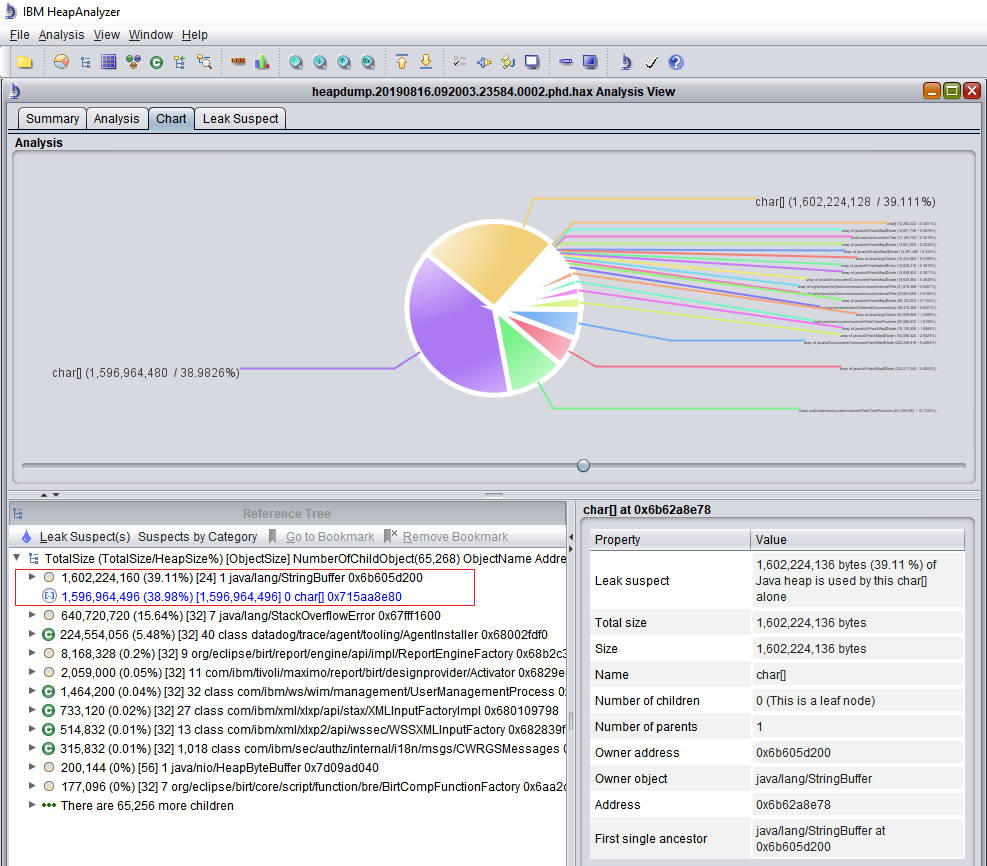
Several core dumps occurred within a short period. The customer was not aware of the unavailability as the system is load balanced. Nevertheless, alarms were sent to our support team and it was treated as a critical incident. When heap dump was opened by Heap Analyzer, it showed a single string buffer and char[] object consumed 40% of the JVM’s heap space.
Figure 2: Analyzer shows a char[] object consumed 1.6Gb of heap space
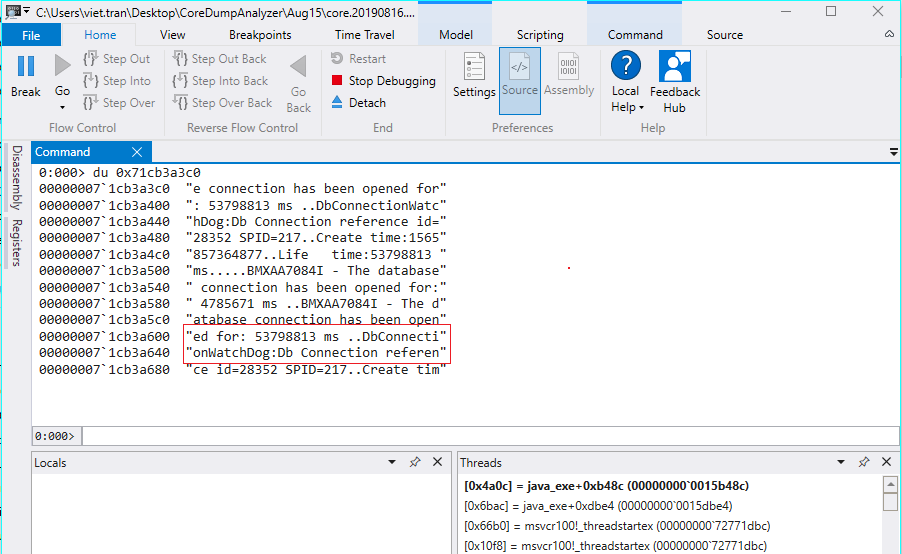
In this instance, since it is a single string object, I attempted to open the core dump file using WinBdg and view the content of this string using the “du” command on the memory address of the char[] object (Figure 3). From the value shown, it looks like a ton of error messages related to DbConnectionWatchDog was added to this string buffer. It was me who, a few days earlier, switched on the DbConnWatchDog on this system to troubleshoot some database connection leaks and deadlocks. In this case, the Maximo’s out-of-the-box DbConnWatchDog is faulty by itself and caused the problem. So, I had to switch it off.
Figure 3: Using the DU command in WinBdg to show the content of a memory address
Case 3 – Server crashed due to memory leak
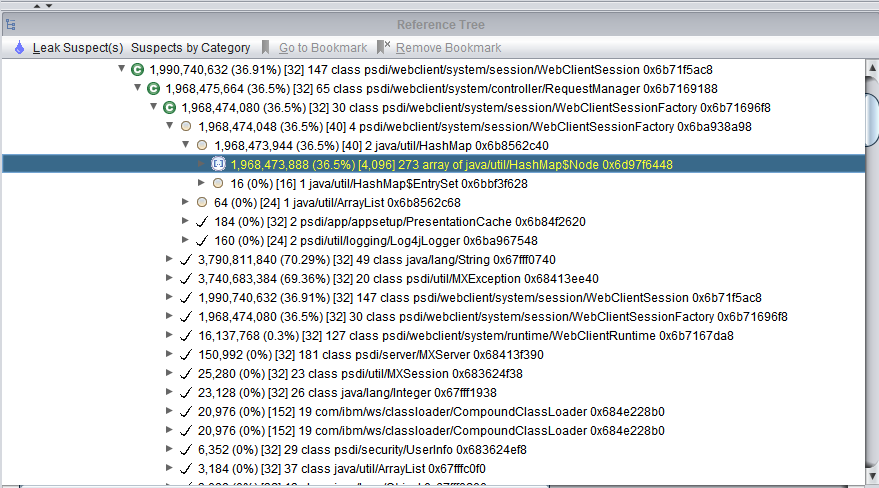
A system consistently thrown OutOfMemory errors and core dumped on the two UI JVMs every 2-3 weeks. Heap Analyzer almost always showed a leak suspect which has some links to a WebClientSessions object. The log file also showed an unusual high number of WebClientSessions created versus the number of logged in users. We know that with this customer, there are a group of users that always open multiple browser tabs to use many Maximo screens at the same time. But it should not create such a disproportionately high number of WebClientSessions. Anyhow, we could not find out what caused it.
Figure 4: Memory leak suspect links to a WebClientSessionFactory object
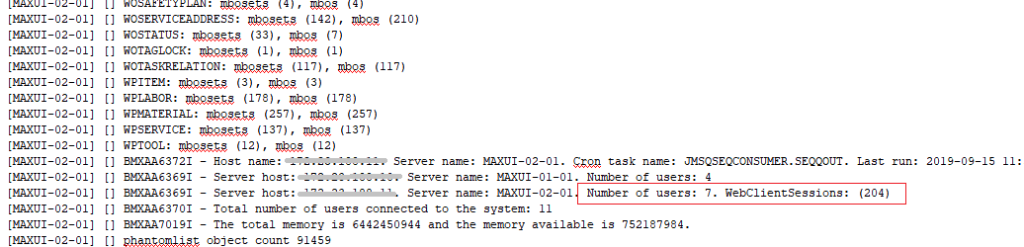
During the whole time troubleshooting the issue, we maintained a channel with IBM support team to seek additional help on the issue. With their suggestions, we switched on various log settings to monitor the issue. The UI logging confirmed that WebClientSessions always get created when a user logged in, but never get disposed. In other words, the total number of WebClientSessions kept growing, and after a period of use, it would consume all JVM heap space and caused the OutOfMemory crash.
Some frantic, random search led me to an article by Chon Neth, author of the MaximoTimes blog, mentioning a memory-to-memory replication setting in Websphere could cause a similar behaviour. I quickly checked and confirmed this setting was enabled in this system. Memory-to-Memory replication is a High Availability setting available in Websphere, but this feature is not supported by Maximo. So, we turned this setting off, and the problem disappeared.
Figure 5: SystemOut.log showed a high number of WebClientSessions vs. number of logged in users
Conclusion
In a lot of cases, identifying the root cause of a JVM Out-of-Memory issue is not always straight forward. Most of the times, the root cause was found with a lot of luck involved. By having the right tools, approaches, and close coordination with the internal and external teams, we can improve our chance of success in solving the problem. I hope by sharing my approach, it helps some of you out there when dealing with such issues.
Out of curiosity, I installed Maximo 7.6.1 on a VM to explore the new features. Then I found that I kind of like it, so I wanted to deploy it on my host OS to get rid of the VM. The trouble is I have Websphere 8.5.5.3 which comes with Maximo 7.6.0.0. I can run maxinst.bat to create demo data with Oracle 11g without a hiccup, but the deployment of the EAR file to Websphere didn’t go well.
It turned out Maximo 7.6.1 requires Java 1.8 and Websphere 9. It’s not possible to upgrade Websphere from version 8 to 9. We will have to install a new Websphere environment and migrate all of the settings which sounds like a lot of work. I decided to tweak it a little bit to make Maximo 7.6.1 runs on Websphere 8.5 using the following process:
1 – Update Installation Manager: Open IM, then open File > Preference, on the left menu, choose Update, check the Search for Installation Manager updates. Then click Ok. Then back to the main Installation Manager screen, click on “Install”, a wizard will pop up to download and update Installation Manager to the latest version (I got 1.8.9 by the time of writing this)
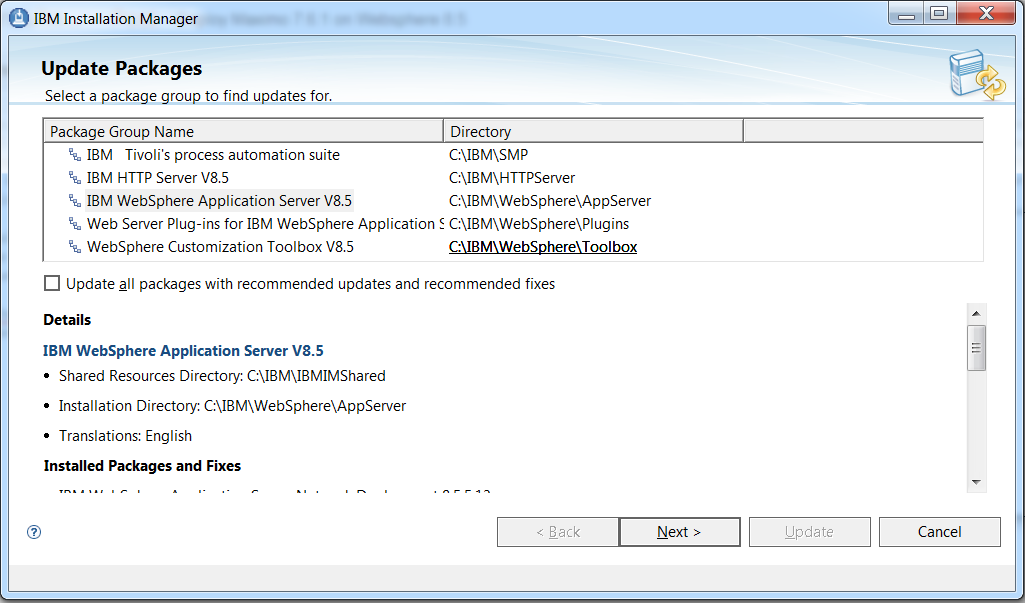
2 – Update Webshere: Open IM after it is updated, click on Update, choose Websphere Application Server 8.5, then follow the wizard. It will download and update Websphere with the latest fix packs. (I got 8.5.5.13)
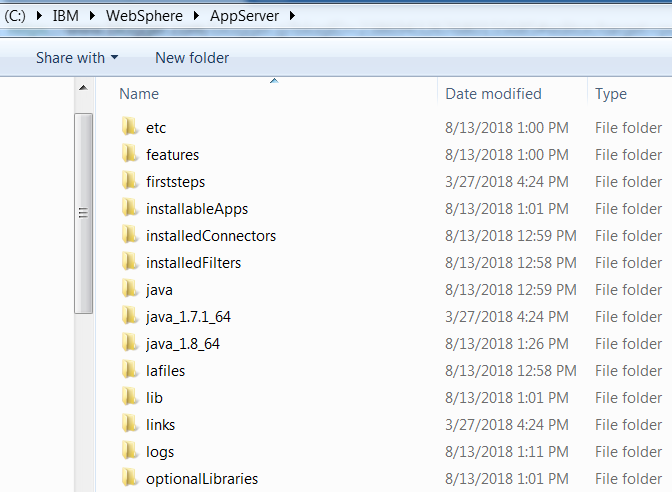
3 – Install JDK 1.8: Open IM again, choose Install, then select ‘IBM SDK Java version 8’ to install it to the existing Websphere. After that, I got both Java 1.7 and Java 1.8 in my Websphere folder:
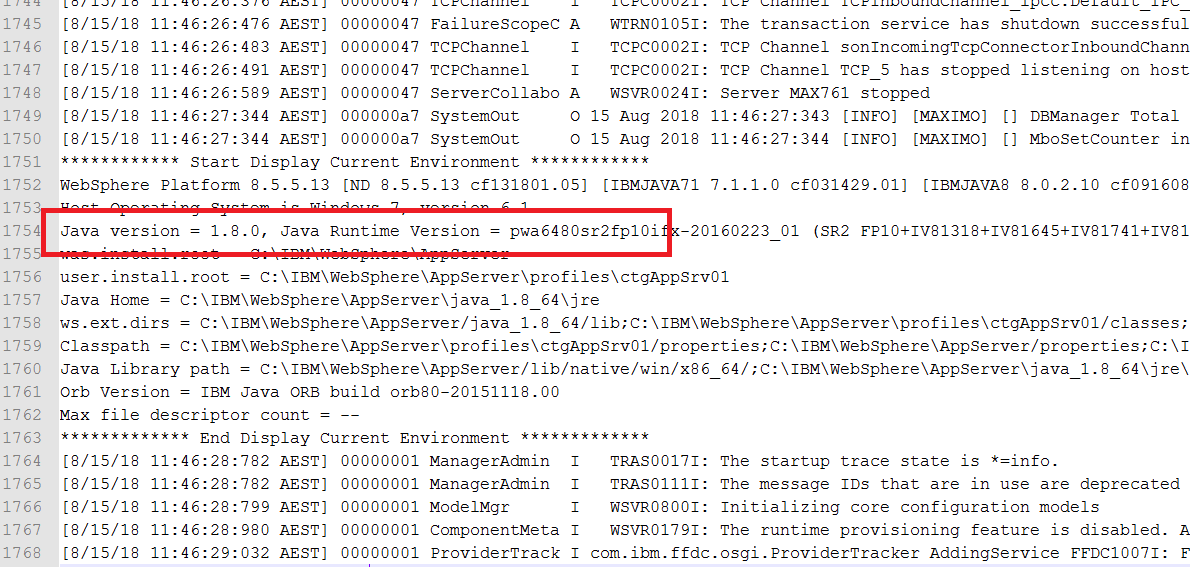
4 – Switch SDK version in Websphere: I used the [WAS_home]/bin/managesdk.cmd tool to change Websphere to use SDK 1.8 following the instruction here. To verify that MXServer uses the correct SDK version, I started MXServer and look at the SystemOut.log file to see the startup log:
5 – Upgrade deploytool: After the above step, I tried to deploy maximo.ear file and it failed. Turned out that the deployment tool of Websphere 8.5 doesn’t work with this new Maximo version. So I cheated by replacing the ‘deploytool’ folder of my Websphere 8.5 environment with the ‘deploytool’ folder I copied from the Websphere 9 environment I got when installing a fresh Maximo 7.6.1 instance in my VM. After that, the deployment process ran without any issues (and it is super fast compared to the previous version, yay!)
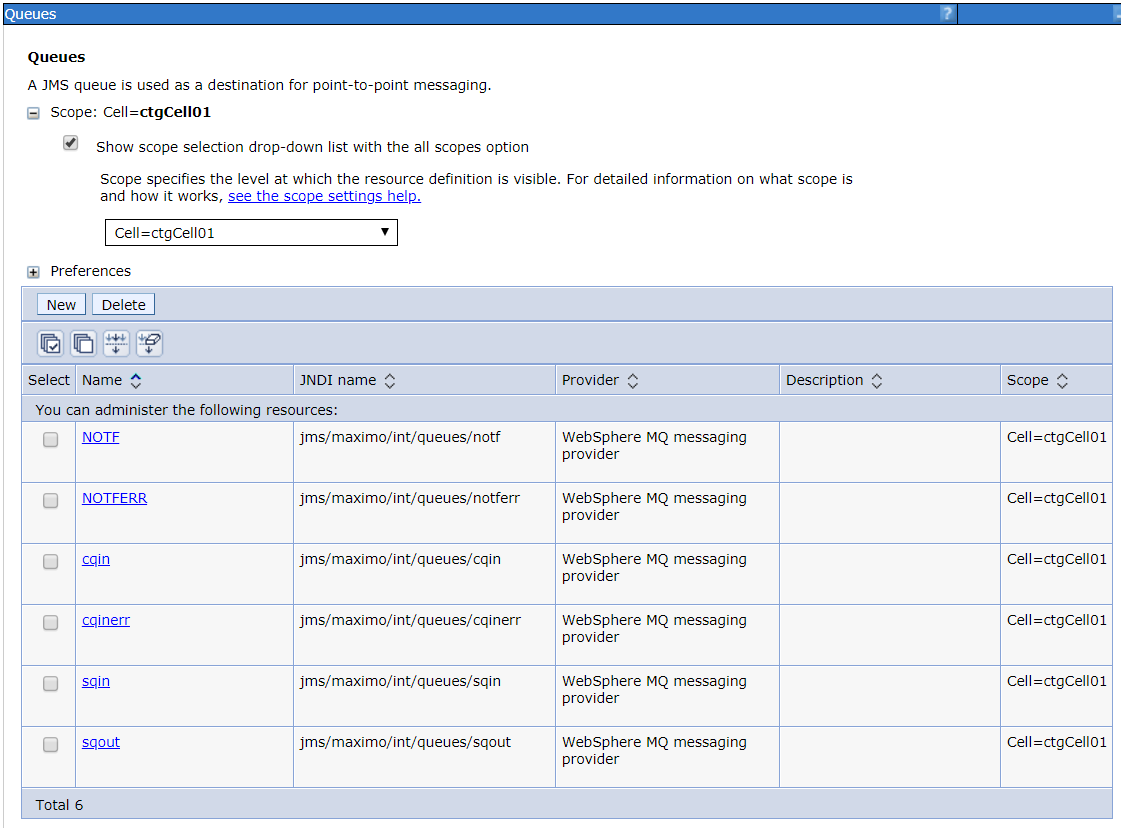
6 – Add new JMS queues: after maximo.ear is deployed, I tried to start MXServer but it failed, turned out there are new queues added to Maximo 7.6.1 which are not there with my existing Websphere environment, so I have to manually add those new queues and activation specifications to Websphere.
In summary for this step, I had to add new queues and activation specifications to Websphere. I basically mimic the settings from the Websphere environment I got in my VM. In the end, I added two queues: NOTF and NOTFERR, and two activation specifications: notfact, and notfacterr. Since I use Websphere MQ, I have to added two bus destinations in Websphere MQ as well. If you use the standard WAS default messaging provider, you simply add the two destinations to the ‘intjmsbus‘. I struggled with this step a little bit as the name of these artefacts are case-sensitive but I didn’t pay attention the first time I created those.
After this step, MXServer starts up without any issue and it works like a charm.
I am a freelance Maximo consultant based in Melbourne. If you enjoy reading my blog, please connect with me on LinkedIn to get updates on new posts. If you or your company need any professional assistance, please leave me a message, I'll call you back.