The OutOfMemory Error
Occasionally, Maximo became unavailable for a short period of 5-10 minutes. Alarms were raised, IT help desk was called, and the issue got escalated to the Maximo specialist (you). You logged into the server, checked the log file, and found a Java Out-of-Memory (OOM) issue. Not a big deal, the server usually restarted itself and became available soon after that. You reported back to the business and closed the issue. Does that scenario sound familiar to you?
If such an issue has only occurred to your system once, it was probably treated as a simple problem. But since you had to search for a solution on the web and ended up here, reading this article, probably it has occurred more than once, the business requires it to be treated as a critical incident. As the Maximo specialist, you’ll need to dig deeper to report the root cause of the issue and provide a fix to prevent it from occurring again. Analyzing low level Java issue is not an easy task, and this post describes my process to deal with this issue.
Websphere Dump Files
By default, when an OutOfMemory issue occurrs, Websphere produces a bunch of dump files in the [WAS_HOME]/profiles/<ProfileName>/ folder, these files can include:
- Javacore.[timestamp].txt: contains high-level details of the JVM when it crashed which should be the first place to look in a general JVM crash scenario. However, in the case if I know it is an OutOfMemory issue, I generally ignore this file.
- Heapdump.[timestamp].phd: this is the dump from the JVM’s heap memory. For an OOM issue, this contains the key data we can analyse to get some further details.
- Core.[timestamp].dmp: These are native memory dump. I get these as I work with Maximo running on Windows most of the time. A different operating system, such as Linux, might produce a different file. I often ignore and delete this file from the server as soon as I find there is no need for it. However, in certain scenarios, we can get some information from it to help our analysis as demonstrated in one scenario described later in this article.
IBM Heap Analyzer and Windows Debugger
In general, with an OOM issue, if it is a one-off instance, we’ll want to identify (if possible) what consumed all JVM memory. And, if it is a recurrence issue, there is likely a memory leak problem, in which case, we’ll need to identify the leak suspects. To analyse the heap dump (PHD file), there are many Heap Analyzer tools available, I use Heap Analyzer provided with the IBM Support Assistant Workbench
To read Windows dump files (DMP file), I use the Windows Debugger tool (WinBdg) that comes with Windows 10. Below are some examples of crashes I had to troubleshoot earlier, hopefully they give you some generally ideas on how to deal with such problem.
Case 1 – Server crashed due to loading bad data with MXLoader
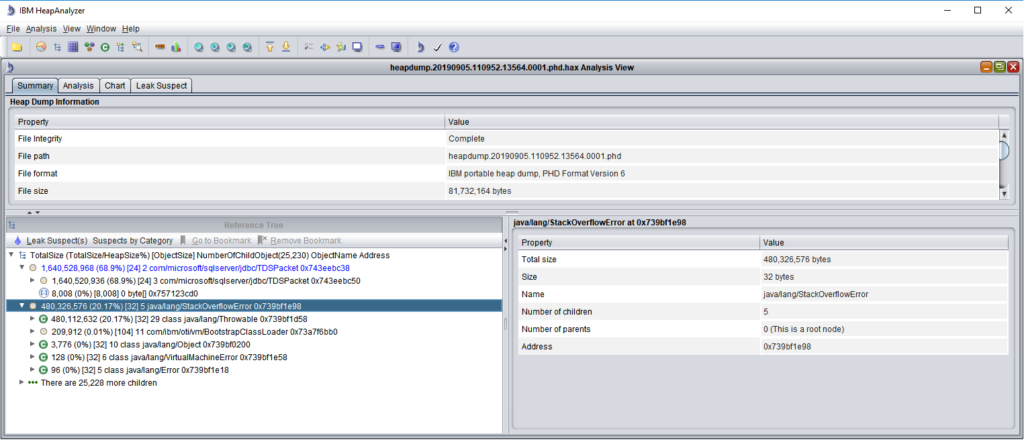
A core dump occurred to the Integration JVM of an otherwise stable system. The issue was escalated to me from level 2 support. Using Heap Analyzer, I could see Maximo was trying to load 1.6 GB of data into memory which equals to 68% of the allocated heap size for this JVM. There was also a java.lang.StackOverflowError object which consumed 20% of the heap space.
This obviously looked weird, but I couldn’t figure out what was the problem. So, I reported this back to the support engineer, together with some information I could find from SystemOut.log that, immediately before the crash occurred, the system status looked good (memory consumption was low), and there was some high level of activities by a specific user. The support engineer picked up the phone to talk with the guy, and found the issue was due to him trying to load some bad data via MXLoader. The solution includes some further training on data loading to this user, and some tightening of Maximo integration/performance settings.
Case 2 – Server crashed due to DbConnectionWatchDog
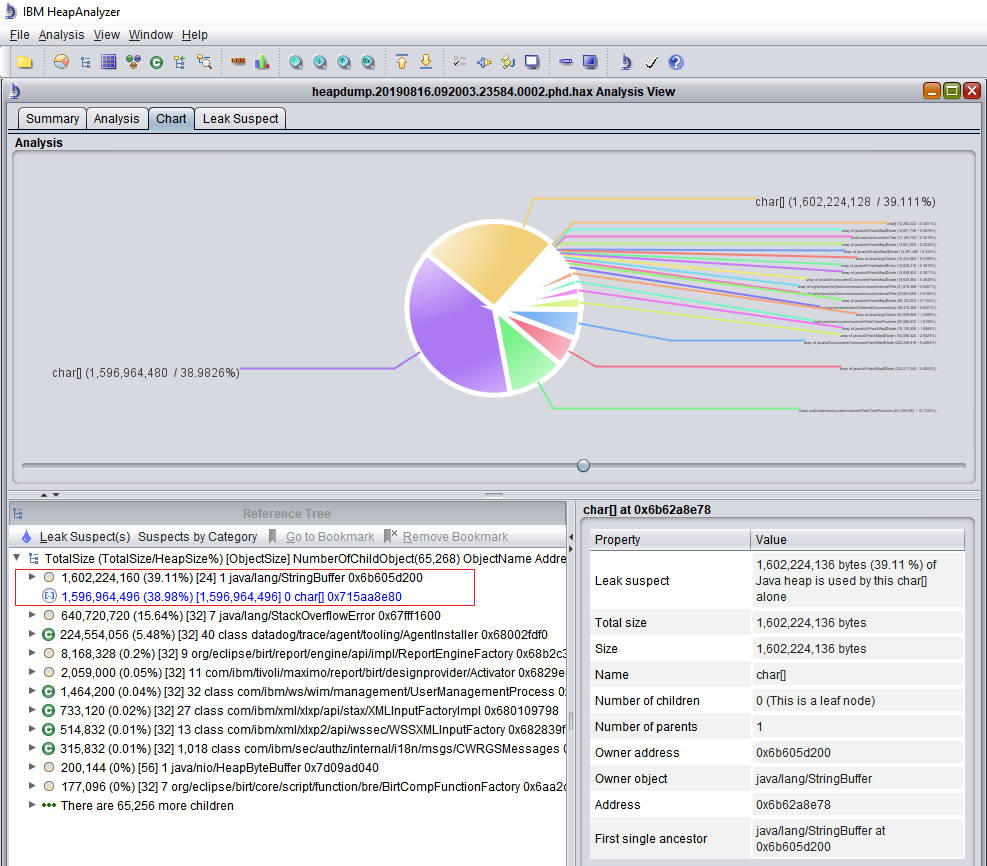
Several core dumps occurred within a short period. The customer was not aware of the unavailability as the system is load balanced. Nevertheless, alarms were sent to our support team and it was treated as a critical incident. When heap dump was opened by Heap Analyzer, it showed a single string buffer and char[] object consumed 40% of the JVM’s heap space.
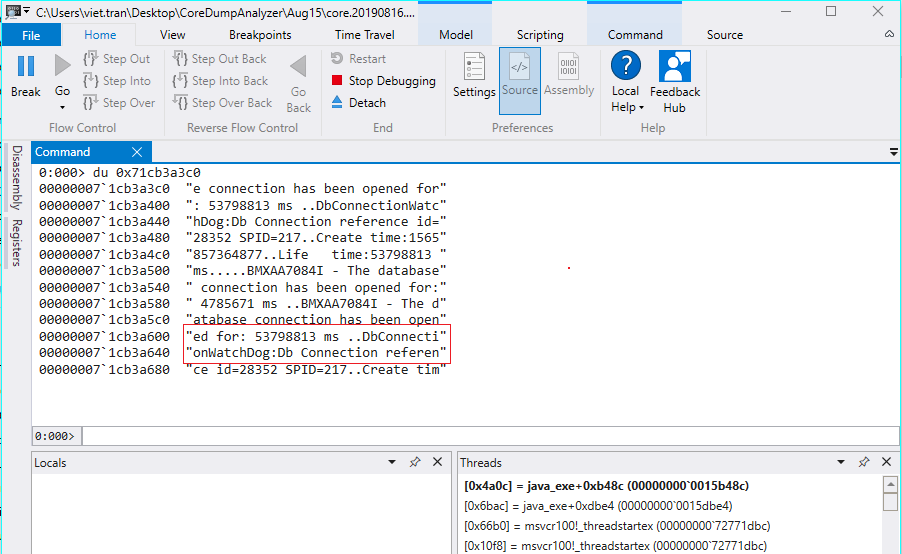
In this instance, since it is a single string object, I attempted to open the core dump file using WinBdg and view the content of this string using the “du” command on the memory address of the char[] object (Figure 3). From the value shown, it looks like a ton of error messages related to DbConnectionWatchDog was added to this string buffer. It was me who, a few days earlier, switched on the DbConnWatchDog on this system to troubleshoot some database connection leaks and deadlocks. In this case, the Maximo’s out-of-the-box DbConnWatchDog is faulty by itself and caused the problem. So, I had to switch it off.
Case 3 – Server crashed due to memory leak
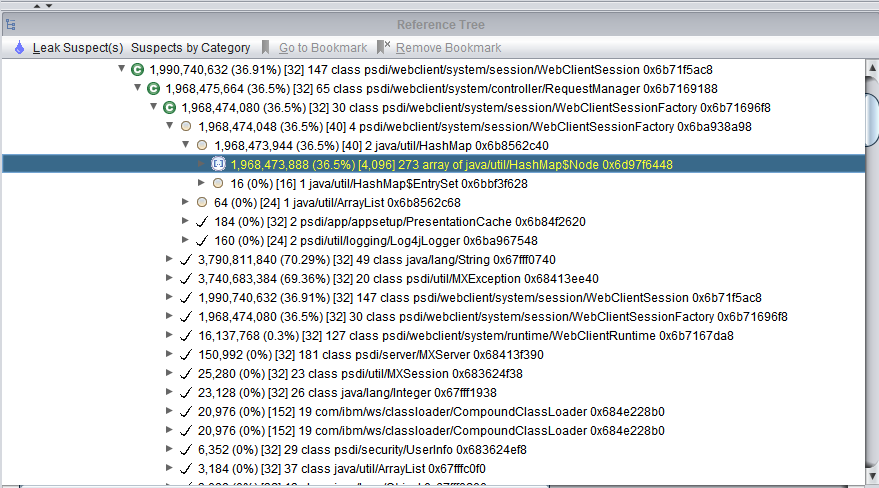
A system consistently thrown OutOfMemory errors and core dumped on the two UI JVMs every 2-3 weeks. Heap Analyzer almost always showed a leak suspect which has some links to a WebClientSessions object. The log file also showed an unusual high number of WebClientSessions created versus the number of logged in users. We know that with this customer, there are a group of users that always open multiple browser tabs to use many Maximo screens at the same time. But it should not create such a disproportionately high number of WebClientSessions. Anyhow, we could not find out what caused it.
During the whole time troubleshooting the issue, we maintained a channel with IBM support team to seek additional help on the issue. With their suggestions, we switched on various log settings to monitor the issue. The UI logging confirmed that WebClientSessions always get created when a user logged in, but never get disposed. In other words, the total number of WebClientSessions kept growing, and after a period of use, it would consume all JVM heap space and caused the OutOfMemory crash.
Some frantic, random search led me to an article by Chon Neth, author of the MaximoTimes blog, mentioning a memory-to-memory replication setting in Websphere could cause a similar behaviour. I quickly checked and confirmed this setting was enabled in this system. Memory-to-Memory replication is a High Availability setting available in Websphere, but this feature is not supported by Maximo. So, we turned this setting off, and the problem disappeared.
Conclusion
In a lot of cases, identifying the root cause of a JVM Out-of-Memory issue is not always straight forward. Most of the times, the root cause was found with a lot of luck involved. By having the right tools, approaches, and close coordination with the internal and external teams, we can improve our chance of success in solving the problem. I hope by sharing my approach, it helps some of you out there when dealing with such issues.




Very helpful article which is linked to critical incidents always.
Very informative blog
Pingback: Performance effect of the Download button in Maximo
Pingback: OutOfMemory error when deploying Maximo in Websphere